MedicalVisualization
MIPt
← Angiography Example | ● | Tumor →
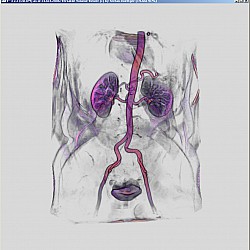
MIPt is called Maximum Intensity Projection over time. Clinical speech is a little inaccurate, since it is no projection per se.
MIPt is the maximum intensity value of a particular voxel that is reached over the course of time.
$MIPt = max_t(f_t)$
With MIPt we do not only see a snapshot of the bolus, but the entire path of the bolues, that is the entire blood circulation.
In the following displayed with DVR GradMag:
← Angiography Example | ● | Tumor →
