3D Medical Visualization [MPR, MIP, Angio & Co.]
Prof. Dr. Stefan Röttger, Stefan.Roettger@th-nuernberg.de
| © 2011–2026 | Stefan Röttger |
This lecture teaches the topic of Medical Visualization with focus on the 3D Display of CT and MR Scanner Data.
What is the scope of this lecture?
We are going to examine and display 3D medical data hands on by employing various kinds of visualization techniques:
Table of Contents:
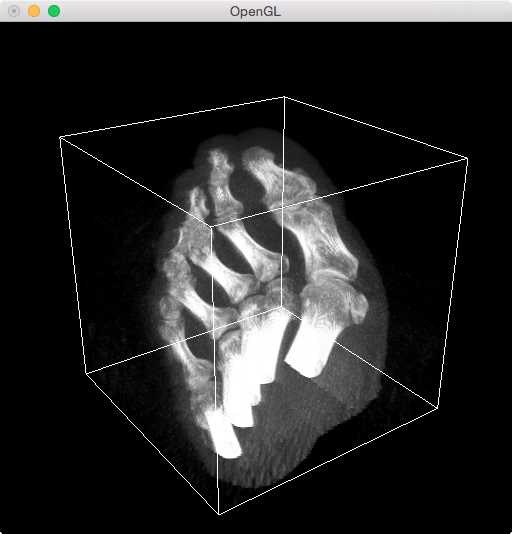
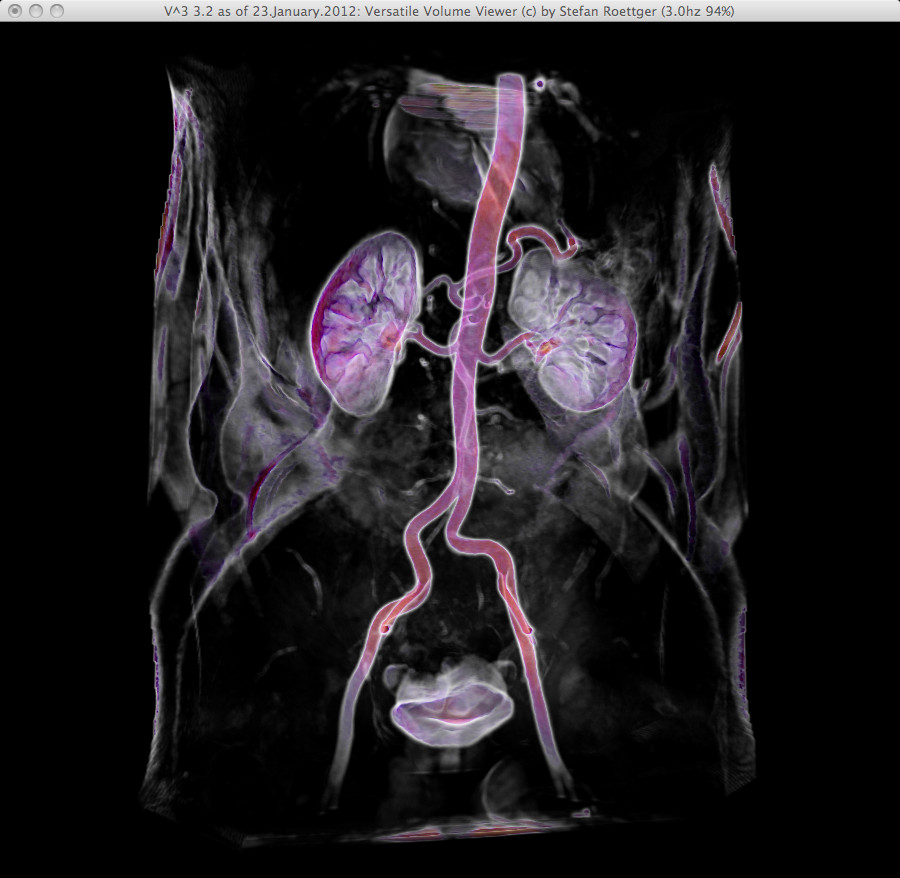
- First Impressions
- Introduction
- Fundamentals
- X-Ray, CT and MRI Data
- 3D Rendering with OpenGL
- 3D Texturing with OpenGL
- DICOM Data
- 3D Data Preprocessing
- ITK: Insight Segmentation Tool Kit
- Time-dependent MR Angio data
- Indirect Visualization Techniques
- Iso-Contouring
- Iso Surfaces
- Direct Visualization Techniques
- MPR: Multi-Planar Reconstruction
- Color-Mapping and Transfer Functions
- VTK: Insight Visualization Tool Kit
- DVR: Direct Volume Rendering
- DVR: Advanced Techniques
Lecture 1
Introduction
Learning Objectives:
Find out what is meant with 3D visualization.
Objectives Test:
In which part of the general area of computer graphics is visualization located?
What is the visualization slogan? (Make the …)
What is the relation of photo-realism and visualization?
What is the difference between Visualization and 3D Medical Visualization?
Is 3D visualization possible without interaction?
Lecture 2
X-Ray, CT and MRI Data RECAP
Learning Objectives:
Get an overview of scanner types, the scan process and associated physical properties of generated 2D and 3D data.
Objectives Test:
What does a CT and MR scanner measure?
Which artifacts can arise with CT and MR data?
Why is MRI data often time-dependent and CT is not?
Describe a typical clinical use case for the two types!
Lecture 3
3D Rendering with OpenGL
3D Transformationen
Zusammengesetzte 3D Transformationen
Perspektivischen Darstellung
Hierarchische Modellierung
OpenGL Primitive
Vertex Attribute
Lecture 4
3D Texturing with OpenGL
Learning Objectives:
Get used to 3D graphics paradigms with OpenGL.
Objectives Test:
Describe the stages of the 3D graphics pipeline.
What are graphics primitives and attributes?
What happens in the rasterization stage of the 3D graphics pipeline?
Which data is processed before the rasterization stage and which data is processed afterwards?
Which parts of the pipeline are programmable?
What is the difference between retained and direct rendering mode?
Which coordinate systems are involved with the pipeline?
What does MVP stand for and how do you compute it with OpenGL?
What is hierarchical modeling?
Which principle steps are required to define and render a 3D scene with OpenGL?
How does 2D texturing work?
How do you render a textured quadrilateral with OpenGL?
Describe the difference between 2D and 3D texturing.
Lecture 5
DICOM Data RECAP
Learning Objectives:
Medical data structures and formats.
Objectives Test:
What is the difference between implicit and explicit, unstructured and regular data?
What is linear interpolation?
What is the best interpolation scheme for regular data? What is its drawback?
What geometric structure do CT and MR data usually have?
How are medical volumes represented in memory and on disk?
What is meant with meta data?
Give examples of medical meta data!
Lecture 6
ITK: Insight Segmentation Tool Kit
Lecture 7
ITK: Insight Segmentation Use Case
Learning Objectives:
Understand that pre-processing is key for medical visualization.
Objectives Test:
What is the difference between a linear and a pull pipeline?
What is a segmentation, registration and a thresholding filter?
Describe at least three medical use cases where pre-processing is beneficial.
How does ITK achieve both time and memory efficiency?
Lecture 8
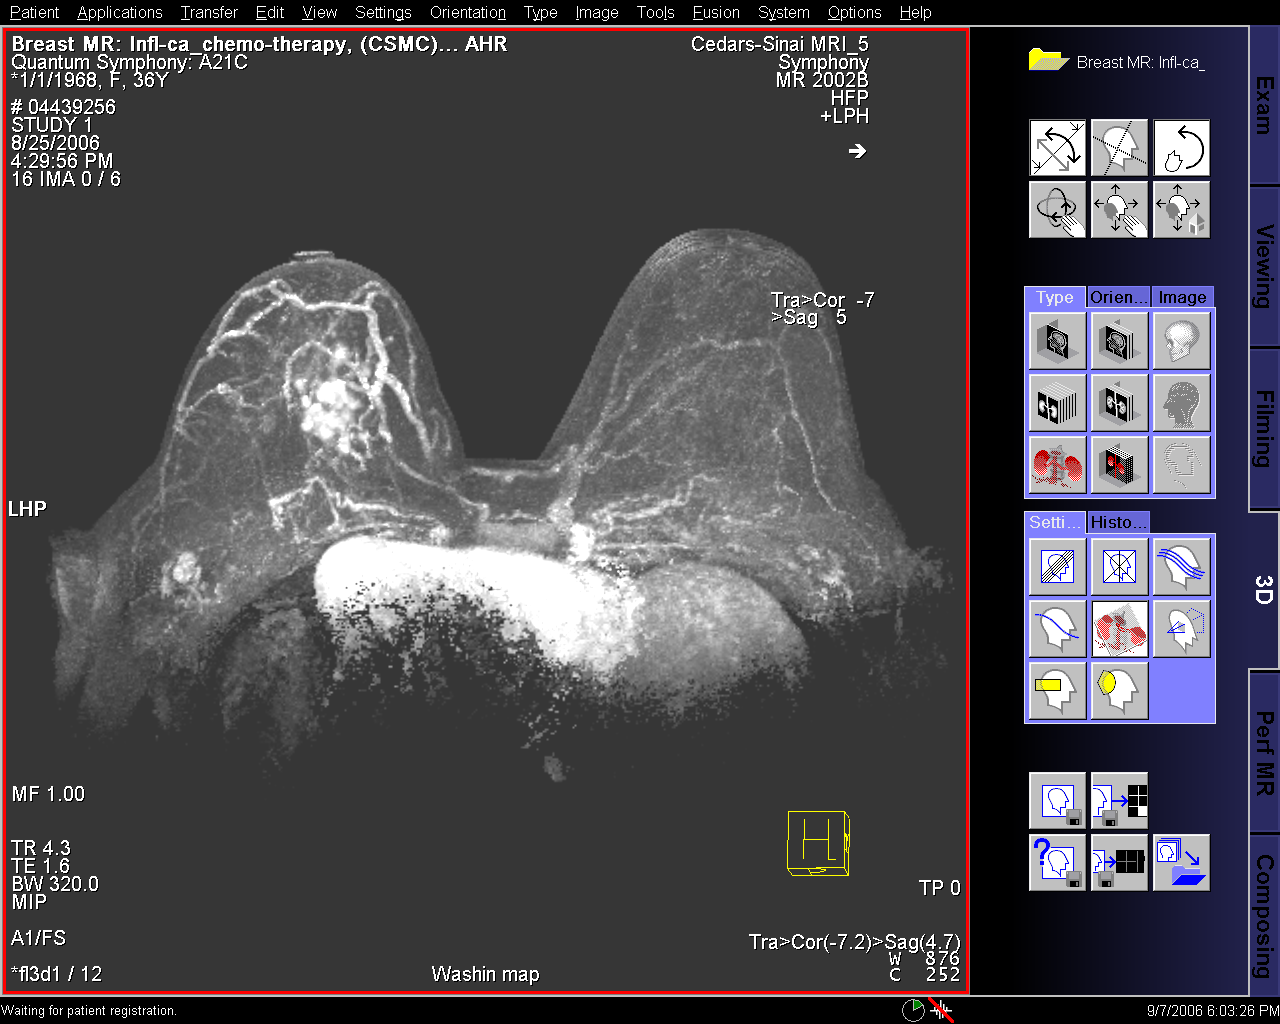
Time-dependent MR Angio data in clinical practice: MIPt, WI, WO and TTP
Learning Objectives:
Learn how to take advatage of 4D MRI data in clinical use cases.
Objectives Test:
What is 4D MR data?
What typical concentration curve can be observed with 4D MR angiography data?
Which 4 parameter maps do you know? What are their characteristics?
Which parameter map shows the entire blood circulation?
Which parameter map can be used to classify tumors?
Which parameter map can be used to separate arteries from veins? What is its drawback?
Lecture 9
Iso-Contouring
Learning Objectives:
Understand iso contouring algorithms.
Objectives Test:
What is a iso value?
What is an iso line? Which characteristics does it have?
How do you extract an iso line?
What is a level set? Which characteristics does it have? What is a typical use case for it?
What is the difference between the quad and the triangle marching algorithm?
Lecture 10
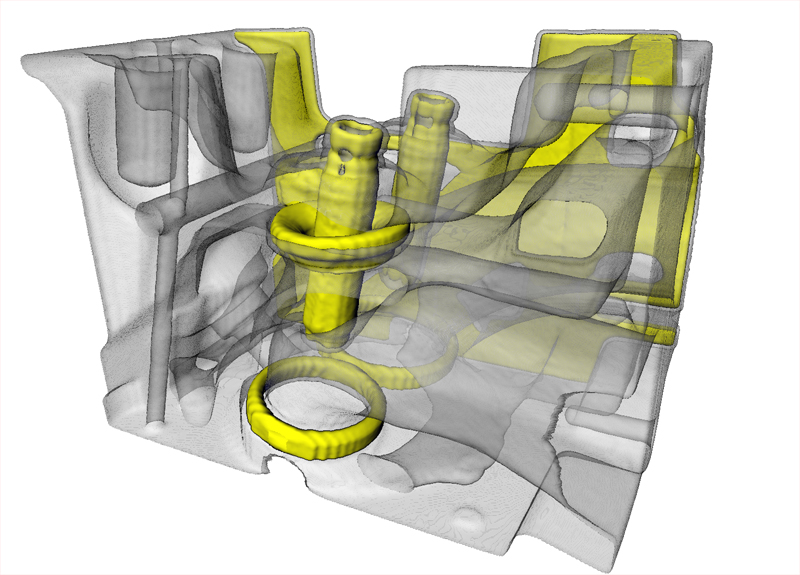
Visualizing Iso Surfaces (Surface Shaded Display)
Learning Objectives:
Learn for which medical use cases iso surfaces are good for.
Objectives Test:
What is an iso surface? Which vegetable is used to described its main characteristics?
How many extraction cases exist for the marching tetreahedra algorithm? Sketch them!
Does it make sense to extract a very small iso value for MR data?
What preprocessing is required to enhance the iso surface quality for MR data?
Lecture 11
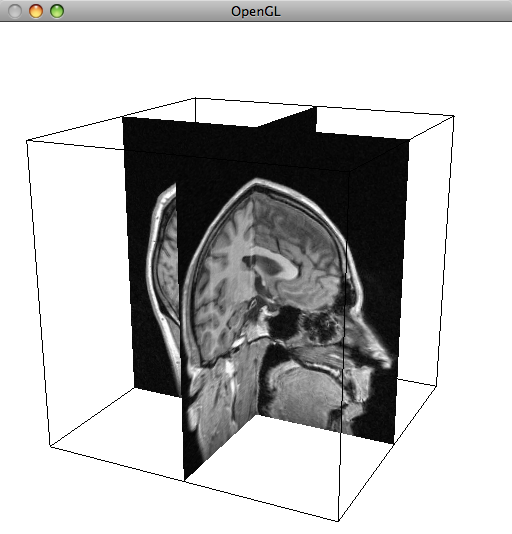
MPR: Multi-Planar Reconstruction with OpenGL
Learning Objectives:
Apply OpenGL 3D texturing for medical visualization purposes.
Objectives Test:
What is a MPR?
How do you principally render a MPR with OpenGL?
Lecture 12
Color-Mapping and Transfer Functions
Learning Objectives:
Apply OpenGL programmable shaders for medical visualization purposes.
Objectives Test:
What is the definition of a so called transfer function?
What is a step transfer function good for?
What is the principle connection of iso values and transfer functions?
Lecture 13
VTK: Insight Visualization Tool Kit
Learning Objectives:
Understand ray-casting and view-aligned slicing.
Objectives Test:
What is ray casting?
Which optical effects are accumulated during ray casting?
How often is a ray typically sampled?
How is the data value at each sample determined?
What is the difference between ray casting and view-aligned slicing?
How can view-aligned slicing be accelerated with graphics hardware?
Which optical model is employed by MIPt?
What is the primary use case for MIPt?
Lecture 14
DVR: Direct Volume Rendering
Learning Objectives:
Understand accumulation of emission and absorption during view-aligned slicing.
Objectives Test:
Which optical model is able to show an impression of depth?
Describe the pros and cons of the above volume rendering techniques, that is mipt, emission, absorption and both combined!
Lecture 15
DVR: Advanced Techniques
Learning Objectives:
See what’s possible with DVR.
Objectives Test:
Which UI components are usally part of a volume renderer like the QtV3!
Describe the principle interaction modes of a volume renderer like the QtV3!
Which rendering techniques can improve the appearance of a rendered volume further?
Which areas of a volume are omitted with the GradMag rendering technique?
For which applications is it particualarly suited? Why?
What preprocessing is required to make it work well?
Exercises
The visualization exercises can be found here.
Exams
Infos about the Visualization Exam
Fin!