Debugging
Given your program is correct, you can start it buy choosing menu item Debug→Start Without Debugging. The output of the programm will appear in an extra console window.
If your program is not correct (but compiles), you can step through the program to explore it while it is working.
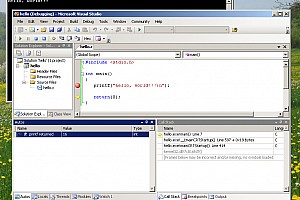
- First, make a break point at the beginning of the code part that you wish to explore. To do so, click on the gray area on the right side of each editor window. A red dot will appear.
- Second, click on the green arrow at the debugging toolbar to start the program (or use menu entry ‘Debug→Start Debugging’). Program execution will halt at the first encountered break point.
- Third, you can execute line after line of the source code by clicking on the Step-Over Button of the debug tool bar. To enter functions click on the Step-Into button. A yellow arrow marks the actual line of execution.
While stepping through the program, you can watch the contents of variables being modified. This information is displayed in the Autos tab of the lower left window section.
The first step that produces unexpected behavior, that is unexpected variable contents, is the one code line in question. The line or one of its predecessors must cause the error.
In the lower right window section the so called call stack is displayed. This is the call hierarchy of the actual function being executed.
For example, the hello world program has a call hierarchy from the kernel to the main function of the hello.exe program:
If a segmentation fault occurs, the top function of the call stack is the one in question.
← Compilation | ●
